

API Monitoring Beyond Ping: Assertions, Latency Budgets and Auth
A 200 OK doesn't mean your API works. Status-code and JSONPath assertions, latency percentiles, authenticated checks and third-party dependencies.
The CompleteStatus Team 6 min read

Want this checked continuously?
CompleteStatus grades your headers, SSL and email security 24/7 — free, commercial use allowed.
API monitoring is where "is it up?" stops being a useful question. An API can return 200 OK on every health check while serving empty arrays to your mobile app, taking 8 seconds on the endpoint your checkout depends on, or rejecting every authenticated request because a token rotation went wrong. Ping-style monitoring (request the base URL, celebrate the 200) catches none of that. Monitoring an API properly means asserting on what it returns, how fast, and whether the requests that matter (the authenticated ones) actually work.
Status codes: assert exactly, not loosely
The first upgrade from ping is being precise about status codes:
- Assert the exact expected code, not "any 2xx/3xx." A
POSTendpoint that should return201returning200may mean your framework is swallowing an error path. An endpoint that should401unauthenticated requests returning200is a security incident, not a success. - Monitor for the right failure, too. A check against
/api/v1/orderswithout credentials should assert it gets401. If that check ever sees200, your auth middleware just fell off. Negative checks are cheap and catch a class of bug nothing else does. - Distinguish 4xx from 5xx in alert routing. A sudden wave of 5xx is your outage; a wave of 4xx after a deploy is usually a contract change that just broke your clients. Different responders, same urgency.
Body assertions: JSONPath is the real health check
Status codes say the server answered; the body says whether it answered correctly. This matters most for the "soft failure" pattern: APIs that return 200 with an error payload, or 200 with empty data.
JSONPath assertions let you pin the actual contract:
GET https://api.example.com/v1/status
  → status code == 200
  → $.status == "ok"
  → $.database.connected == true

GET https://api.example.com/v1/products?limit=5
  → status code == 200
  → $.data length > 0
  → $.data[0].price exists
Guidelines that pay off:
- Assert on fields that prove work happened, not just envelope fields.
$.databeing a non-empty array proves the database answered;$.success == trueonly proves someone set a flag. - Pin the fields your clients depend on. If your mobile app reads
$.data[0].price, assert it exists. When a backend refactor renames it tounit_price, your monitor fails before your app-store reviews do. - Make your health endpoint honest. A
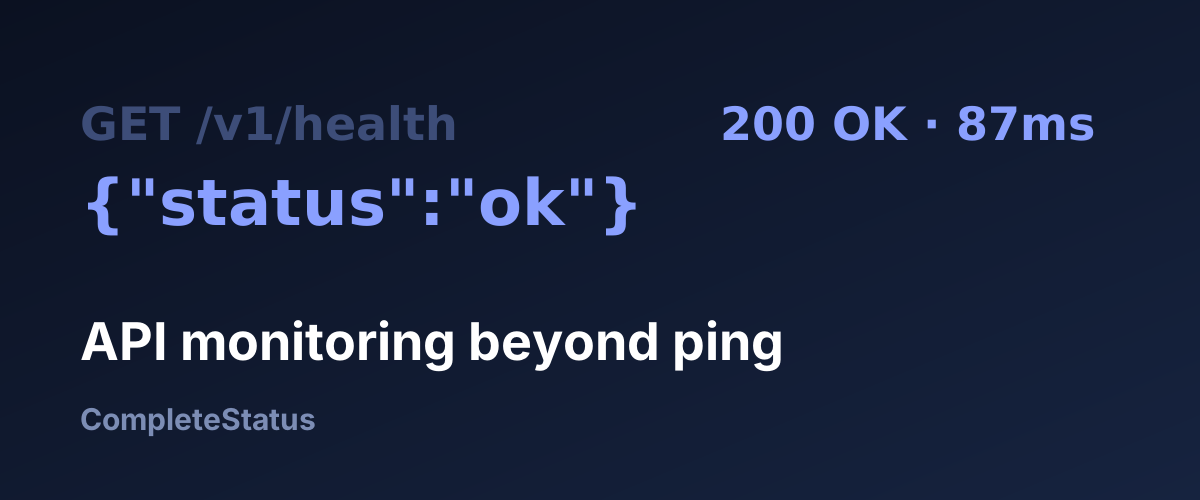
/healththat returns{"status":"ok"}unconditionally is decorative. Have it actually touch the database, cache and queue, then assert on each sub-field. A health check that can't fail can't help you.
Latency: budgets and percentiles, not averages
APIs rarely fall over; they degrade. The endpoint that took 120 ms in March takes 900 ms in May, and nobody notices because "it's up." Two practices catch this:
- Set a latency budget per endpoint and alert on sustained breaches. A search endpoint might get 500 ms; a checkout-critical call 250 ms. The budget forces the conversation about what "slow" means before users have the conversation for you.
- Watch percentiles, not averages. An average of 200 ms can hide a p95 of 3 seconds: 1 in 20 requests is awful, and a user making 20 API calls per session will very likely hit one. Track p95/p99 over time; a creeping p99 is your earliest warning of an index gone stale, a connection pool saturating, or an N+1 query shipped last Tuesday.
Trend matters more than any single reading. A response-time chart that has drifted up 15% a week for a month is an incident scheduled in advance.
Monitoring authenticated endpoints
Your most important endpoints are behind auth, which is exactly why many teams don't monitor them. The unauthenticated surface gets watched; the part users actually pay for doesn't.
Doing this properly:
- Create a dedicated monitoring credential: a service account or API key used only by monitoring, with read-only, least-privilege scope. Never reuse a real user's token: you want to be able to rotate or revoke it without breaking anything else, and see it distinctly in your logs.
- Your monitoring tool must store secrets encrypted at rest. You are handing it a working credential to your API. CompleteStatus stores bearer tokens, basic-auth passwords and API keys encrypted, never shows them again after saving, and masks them in results and logs.
- Monitor token expiry as its own failure mode. If your monitoring credential expires, you'll get a false "API down" alert, or worse, someone "fixes" the alert by disabling the monitor. Use long-lived, rotated credentials, and calendar the rotation.
- Watch out for monitoring pollution: exclude your monitoring account from analytics and rate limits, or you'll spend an afternoon investigating a "user" who hits checkout every 60 seconds forever.
The APIs you don't own
Your product depends on APIs you can't fix: payments, email delivery, maps, AI providers. Their status pages are marketing documents that update on their schedule, not yours. Monitor your critical third-party dependencies yourself (the specific endpoints you call, with your latency budgets) so that when Stripe or your email provider degrades, you know from your own dashboard, immediately, and can flip on a fallback or post to your status page while their status page is still green. During an incident, "is it us or them?" is the first question; independent monitoring answers it in seconds. (It's also step zero of the website-down triage runbook: confirm where the failure actually lives.)
Staging and prod: monitor both, alert differently
Run the same assertion suite against staging as production: same checks, different routing. Staging failures go to Slack as a heads-up (you just caught a breaking change before deploy); production failures page a human. What you're building is a contract test that runs continuously: if the JSONPath assertions pass in staging but the deploy breaks them in prod, you've isolated an environment-config problem, not a code problem. Keep intervals looser in staging and never share credentials between the two environments.
One suite, everything asserted
Real API monitoring is a small pyramid: exact status codes at the base, body assertions proving the data is real, latency percentiles catching degradation, auth'd checks covering what users actually touch, and independent eyes on third-party dependencies. CompleteStatus's API monitoring covers this: status-code, latency and JSONPath assertions, response-time and p95 tracking, custom headers and encrypted auth, and confirmation over two consecutive checks so a single network blip doesn't page you. It lives in the same dashboard as your uptime, SSL, DNS and cron-heartbeat monitoring.
Start with your health endpoint: run it through the free uptime test, then create a free account and add real assertions. The free plan includes 10 monitors, and commercial use is allowed.
Written with AI assistance and reviewed by the CompleteStatus team.
Get notified when CompleteStatus opens
New accounts are closed while we're in private beta. Leave your email and we'll send one message the moment sign-ups open — nothing else.